Cruise ships are incredibly unsafe!! They must be... that's what we see constantly on social media, right?
How often have you stopped scrolling to watch some a fight break out on a Carnival lido deck? Or clicked through to a story of someone falling off a cruise ship? These click-bait headlines suggest you'll be boarding a floating Tijuana. Have fun on your anarchy-barge, suckers.
Are Cruise Ships Required to Report Crimes?
Absolutely, yes! The Cruise Vessel Security and Safety Act of 2010 (CVSSA) requires cruise ships that embark or disembark passengers in U.S. ports to report allegations of serious crimes to the FBI and the U.S. Coast Guard. Cruise lines have to make this data publicly available on the U.S. Coast Guard at quarterly intervals. This is where we sourced the cited data found below.
But wait just a moment. The statistics suggest something drastically different than implied by these click-hungry, fear-mongers.
Thanks to publicly available FBI crime statistics for cruise ships and well-documented city-level crime data, we can easily expose these as narratives as pure propaganda. Spoiler... you're safer on a cruise ship than any U.S. city, by a factor of "lots."
Below, we examine three major crime categories.
- Homicide
- Sexual Assault
- Assault with Serious Bodily Injury
Why did we pick this trio? These crimes are standardized amongst land and sea, making comparison easiest for these categories. While they obviously aren't comprehensive, they can certainly serve as proxy for "crime" in general.
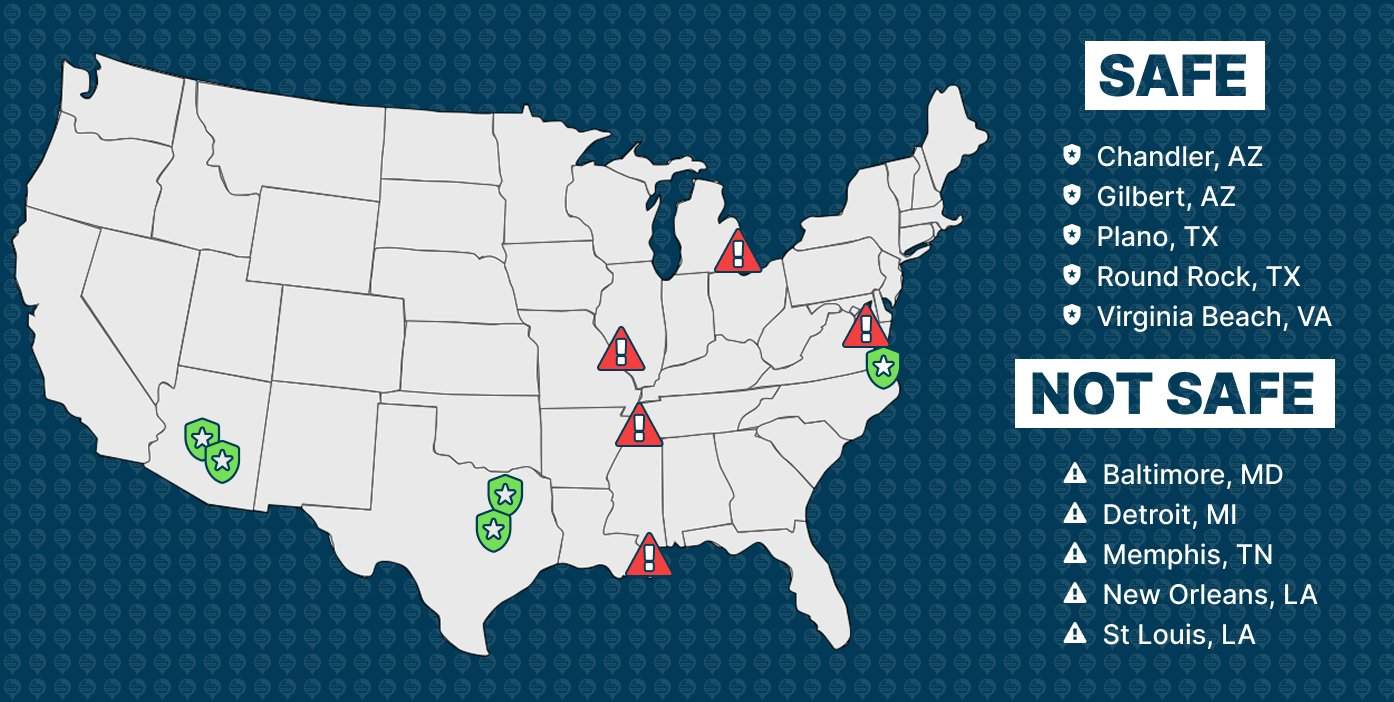
- Chandler, TX
- Gilbert, AZ
- Plano, TX
- Round Rock, TX
- Virginia Beach, VA
- Baltimore, MD
- Detroit, MI
- Memphis, TN
- New Orleans, LA
- St Louis, LA
For the analysis below, we compared the rates of incidents per million annual passengers on cruise ships versus the crime rates per million residents of 10 U.S. cities. We chose the five cities considered the "safest" and five on record as "most dangerous" within the United States.
Let's dive in and see just how dangerous cruise ships are when compared to major U.S. cities! We'll start with the biggie... Homicide.
☠️ Homicide
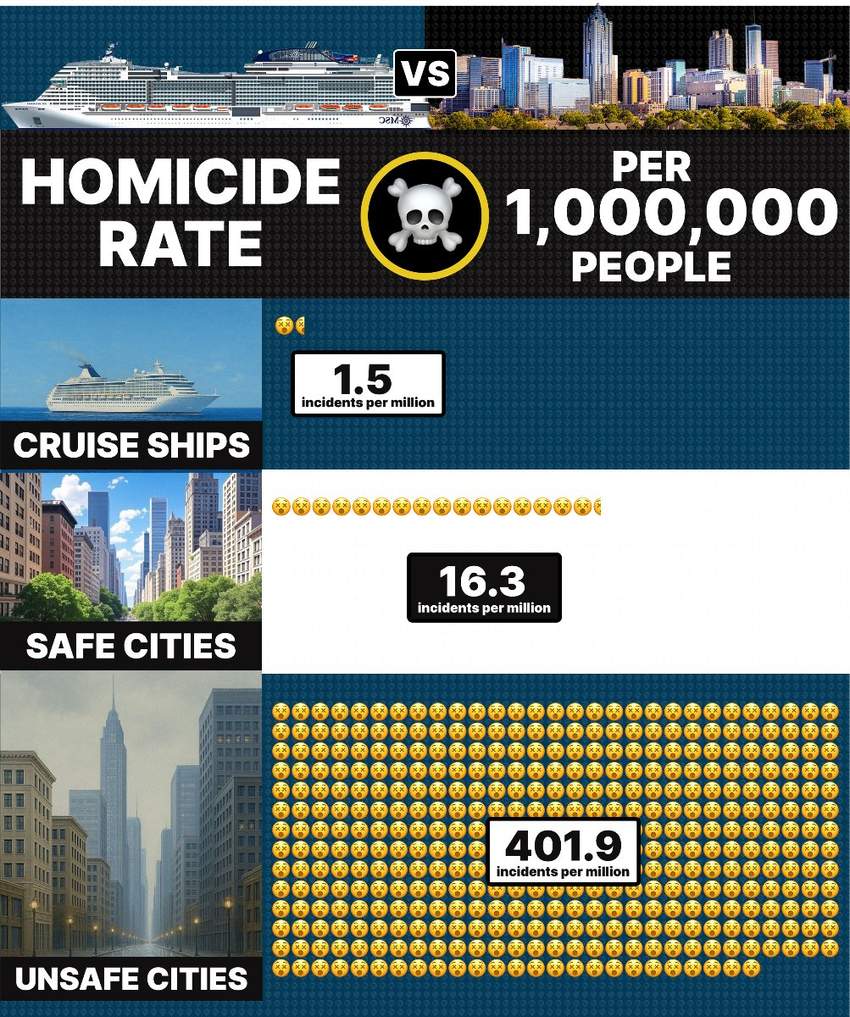
Cruise Ships vs Cities - Annual Homicide Rate
Cruise ships are way cheaper than a divorce, amiright? Sensational headlines suggest spouses are frequently tossed overboard. Apologies to those looking for a cheap way out, but cruise ship murders are less frequent than even the safest cities by a factor of roughly 10x. We'd humbly advise going through the courts.
The data below includes recorded homicide rates for the previous few years. While we currently have crime stats for cruise ships through Q1 of 2025, crime data for cities is only available through 2023 (not surprisingly).
☠️ Homicide Rates
Annual Incidents per Million Passengers or Residents
| Cities vs Cruise Ships | 2020 | 2021 | 2022 | 2023 | 2024 |
|---|---|---|---|---|---|
| Cruise Ships | 0.0 | 3.8 | 0.0 | 1.6 | 1.5 |
| Safest Cities | 14.7 | 19.0 | 11.3 | 17.9 | 16.3 |
| Least Safe Cities | 594.1 | 604.2 | 610.2 | 529.9 | 401.9 |
👊 Assault with Serious Bodily Injury
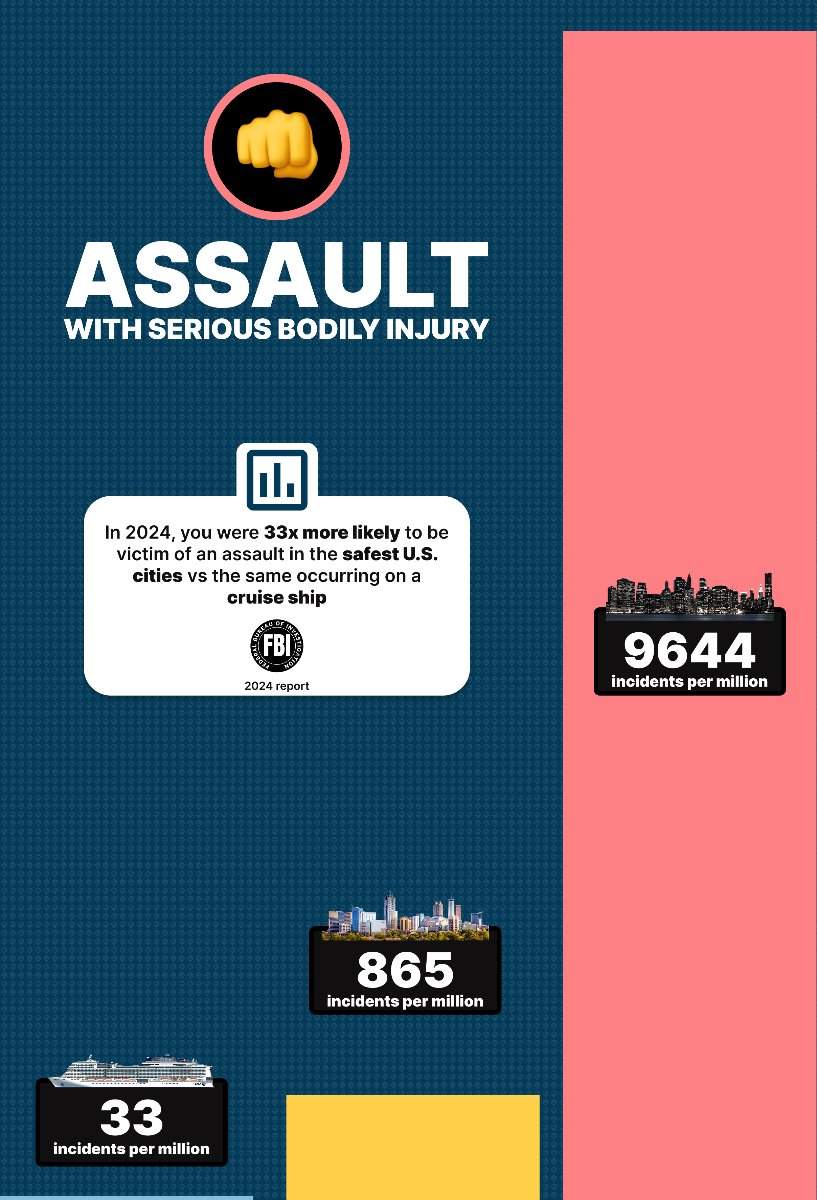
Cruise Ships vs Cities - Annual Assault Rates
We're familiar with this crime thanks to TikTok and Instagram. It's not difficult to find cruise ship fight videos online. Fortunately, it's far more difficult to find them in the real world.
First, a caveat. City-level ‘Aggravated Assault’ statistics include incidents involving attempts or threats with a deadly weapon or intent to cause serious injury, which may not always result in actual serious bodily injury. By contrast, cruise-ship incidents reported to the FBI under ‘Assault with Serious Bodily Injury’ generally involve actual serious injury sustained by the victim. Therefore, rates may not be perfectly aligned but are the closest comparable metric available.
Additionally, reporting thresholds on cruises are stricter: ships are obligated to report all qualifying incidents to the FBI, while city reporting can vary in thoroughness.
The legitimacy of the comparison seems to pass the "sniff test." The scale between reported incidents between cruise ships and cities are in line with the above, homicide crime stats, which are a perfectly consistent in definition between land and sea. As with your chances of getting murdered at sea, the likelihood of getting seriously beat up is less than 10x on a cruise ship vs the safest cities in the U.S.!
When comparing your chances vs the nation's worst cities, you're 268x less likely to end up on a viral TikTok fight video.
👊 Assault Rates
Annual Incidents per Million Passengers or Residents
| Cities vs Cruise Ships | 2020 | 2021 | 2022 | 2023 | 2024 |
|---|---|---|---|---|---|
| Cruise Ships | 0.0 | 3.8 | 0.0 | 1.6 | 1.5 |
| Safest Cities | 14.7 | 19.0 | 11.3 | 17.9 | 16.3 |
| Least Safe Cities | 594.1 | 604.2 | 610.2 | 529.9 | 401.9 |
🚫 Sexual Assault
Cruise Ships vs Cities - Annual Sexual Assault Rates
This is a sensitive topic, but we felt obligated to include it. Of all tracked crime statistics, Sexual Assault is the obvious outlier. Here we don't see the drastic difference in scale as with the other types of crimes.
Why are sexual assaults on cruise ships roughly 40% of that found in our safest cities? We can only speculate, but have a few guesses.
- Vulnerability & Isolation: While overall security is high, cabins offer a private, isolated space. Victims can be isolated by perpetrators, sometimes with the use of alcohol or drugs.
- Alcohol Consumption: Vacation environments, including (or maybe especially) cruises, often involve increased alcohol consumption, which can impair judgment, lower inhibitions, and make individuals more vulnerable to victimization.
- "Vacation Mentality" & Lowered Guard: People on vacation may be more trusting, less cautious, and more open to social interactions, which can be exploited by predators.
- Power Dynamics (Crew on Passenger): A significant portion of sexual assaults on cruise ships are alleged to involve crew members as perpetrators. There's a clear power imbalance, and crew members may have access to cabins or be in positions of authority that can be exploited.
- "Flags of Convenience" and Jurisdiction: Cruise ships often operate under "flags of convenience" (registered in countries like Panama or the Bahamas). This can create a perception of less rigorous immediate law enforcement response compared to a domestic city police force.
The table and graph below show the average sexual assault incidents on cruise ships vs the same in U.S. cities.
🚫 Sexual Assault Rates
Annual Incidents per Million Passengers or Residents
| Cities vs Cruise Ships | 2020 | 2021 | 2022 | 2023 | 2024 |
|---|---|---|---|---|---|
| Cruise Ships | 163.9 | 30 | 145.7 | 159.6 | 142.8 |
| Safest Cities | 340.4 | 350.4 | 326.4 | 313.9 | 328.7 |
| Least Safe Cities | 624.9 | 639.4 | 622.8 | 602.0 | 643.7 |

Cruise Ship vs City Crime Rates - Aggregated Summary
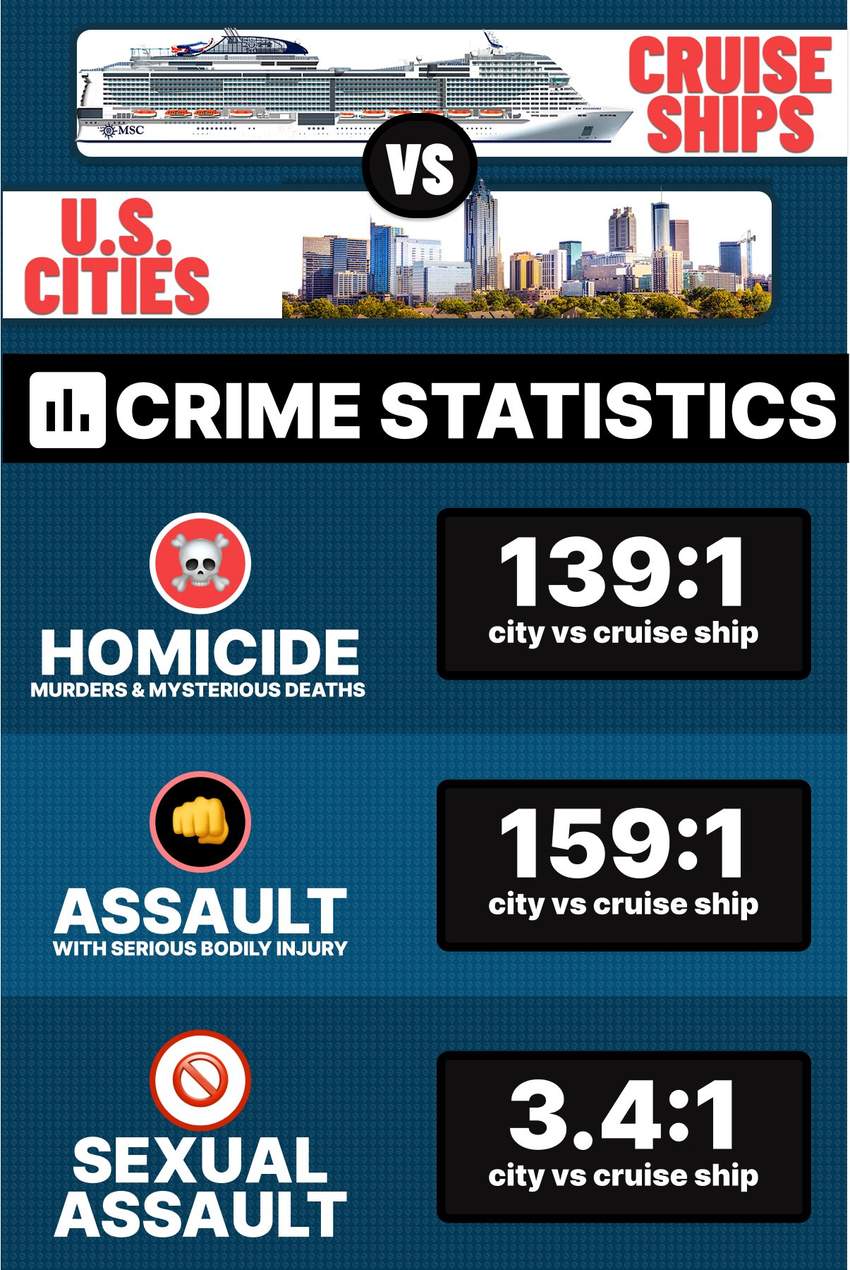
The infographics above compare cruise ship crime rates to our nation's safest and least safe cities.
The image below combines these cities into one sample group to compare to cruise ships. It also provides a great shareable image for this page, which we hope you take advantage of.
Here's a summary of the statistics shown below.
- Homicide: You are 139 times more likely to get murdered in one of these US cities than on a cruise ship.
- Assault with Serious Bodily Injury: You are 159 times more likely to get a serious beatdown in these U.S. cities than on a cruise ship.
- Sexual Assault: You are 3.4 times more likely to be a victim of sexual assault in these U.S. cities than on a cruise ship.
Cruise Ship Crime Rates - Analysis
In each crime rate metric, there are drastically fewer incidents on cruise ships vs U.S. cities. Again, this is true even when compared to our nation's safest communities! You are far more likely to be a victim in the darling town of Chandler, AZ than on the Carnival Dream cruise ship.
This begs the question, "why?" And how is it possible that there's such a drastic difference in safety between cruise ships and cities?
Here are some notable possibilities to explain this phenomenon.
Data Analysis Methodology
The comparison between cruise ship safety and that of U.S. cities isn't "apples to apples."
We can’t just compare the number of annual passengers (roughly 30 million) to a city’s population, because the city’s population is present 365 days a year, while cruise passengers are only present on board for ~7 days each, on average. The "risk exposure” per passenger is limited to those 7 days. Using a denominator of 30 million would result in an unfair bias towards cruise ships.
To compare fairly, we need to estimate the average daily cruise population (the number of people physically on cruise ships on any given day of the year) to compare with a city’s resident population.
That means the “daily population” of the cruise ship ecosystem would be roughly 575,000. This is obviously a much smaller population than 30M, which makes sense because people are only “residents” for a week at a time.
This methodology was applied to each year's fluctuating cruise volume when determining the average incident per million passengers.
In an effort to double-check this logic, we also analyzed the cruise ship capacity for all active ships for the lines used in our crime analysis. The total capacity for these ships is roughly 575,000 passengers. Historically, ships are booked at just over 100% capacity. This figure aligns well with our estimate using overall cruise passengers and an average 7-day sailing.
Resources Used
Raw statistics were collected using the official reports from many public entities, at both federal and local level. In most cases, raw data was aggregated, isolated and normalized using multiple LLM's.
US Department of Transportation: quarterly cruise ship incident reports are provided for each major cruise line. Reports found here.
Wikipedia: used for collection of crime statistics as well as city population. Main page found here.
State Reports: reports were analyzed at the state level for each of the 10 analyzed locations. Examples found here for Arizona; Texas; Louisiana, Tennessee, etc.
Municipality Reports: reports were analyzed at the city level for each of the 10 analyzed locations. Examples found here for Plano, Virginia Beach, Memphis, New Orleans, etc.
MCCA Reports: promoting innovation and the adoption of evidence based best practices and frequently cited by multiple LLM's. Reports found here.
Share with the Cruise Naysayers
We hope that this Cruise Crime Report sheds some light on the current state of "safety" when it comes to our land-vs-sea vacation preferences.
The common narrative seen by mainstream news sources, social media, and even Netflix suggest that cruise travel is unsafe. Given the statistics above, this is objectively false.
While there exists some ambiguity in the reporting and comparisons of each, cruise ships vs cities, the overall metrics definitely show that cruising is significantly safer on the metrics analyzed above. And these three markers can be logically used as proxy for "crime" overall.
Please help us share this post with the general community so that we can promote one of the safest (and most fun) travel options available!
