
Carnival Mardi Gras
The average price per night, per person, across every future Carnival Mardi Gras sailing Gangwaze tracks, by cabin type, with the Carnival Cruise Line fleet and the whole market beside it.
Based on 101 upcoming sailings of Carnival Mardi Gras with live balcony fares. Updated November 7, 2026.
Carnival Mardi Gras vs the fleet
The last 24 months of the average balcony price per night on Carnival Mardi Gras, with the Carnival Cruise Line fleet and the whole market shown for comparison.
| Month | Price per night | Carnival avg | All lines |
|---|---|---|---|
| NOV '24 | $177 | $181 | $220 |
| DEC '24 | $185 | $186 | $222 |
| JAN '25 | $181 | $185 | $224 |
| FEB '25 | $178 | $184 | $225 |
| MAR '25 | $181 | $185 | $221 |
| APR '25 | $179 | $182 | $213 |
| MAY '25 | $174 | $180 | $211 |
| JUN '25 | $177 | $180 | $209 |
| JUL '25 | $177 | $178 | $208 |
| AUG '25 | $175 | $175 | $209 |
| SEP '25 | $176 | $176 | $212 |
| OCT '25 | $175 | $177 | $211 |
| NOV '25 | $169 | $172 | $209 |
| DEC '25 | $168 | $171 | $209 |
| JAN '26 | $151 | $168 | $211 |
| FEB '26 | $153 | $164 | $215 |
| MAR '26 | $158 | $166 | $211 |
| APR '26 | $162 | $169 | $213 |
| MAY '26 | $158 | $166 | $212 |
| JUN '26 | $154 | $163 | $203 |
| JUL '26 | $152 | $162 | $210 |
| AUG '26 | $155 | $167 | $209 |
| SEP '26 | $155 | $169 | $212 |
| OCT '26 | $151 | $167 | $211 |
| NOV '26 | $153 | $167 | $211 |
| Month | Price per night | Carnival avg | All lines |
|---|---|---|---|
| NOV '24 | $177 | $181 | $220 |
| DEC '24 | $185 | $186 | $222 |
| JAN '25 | $181 | $185 | $224 |
| FEB '25 | $178 | $184 | $225 |
| MAR '25 | $181 | $185 | $221 |
| APR '25 | $179 | $182 | $213 |
| MAY '25 | $174 | $180 | $211 |
| JUN '25 | $177 | $180 | $209 |
| JUL '25 | $177 | $178 | $208 |
| AUG '25 | $175 | $175 | $209 |
| SEP '25 | $176 | $176 | $212 |
| OCT '25 | $175 | $177 | $211 |
| NOV '25 | $169 | $172 | $209 |
| DEC '25 | $168 | $171 | $209 |
| JAN '26 | $151 | $168 | $211 |
| FEB '26 | $153 | $164 | $215 |
| MAR '26 | $158 | $166 | $211 |
| APR '26 | $162 | $169 | $213 |
| MAY '26 | $158 | $166 | $212 |
| JUN '26 | $154 | $163 | $203 |
| JUL '26 | $152 | $162 | $210 |
| AUG '26 | $155 | $167 | $209 |
| SEP '26 | $155 | $169 | $212 |
| OCT '26 | $151 | $167 | $211 |
| NOV '26 | $153 | $167 | $211 |
How Carnival Mardi Gras compares
Carnival Mardi Gras costs 9% less per night than the average Carnival ship and 28% less than the market.
The Carnival fleet by age and price
Do newer cruise ships cost more?
Across all lines, ships built 2020-24 average $219 a night for a balcony cabin, 9% more than ships built 2000-04. Carnival Mardi Gras costs 30% less than the average ship built 2020-24.
Carnival Mardi Gras price by sail month
Average balcony price per night for each of the next 18 sail months with a fare. Green months cost less than the ship's average of $153, red months cost more. Each month opens a search for Carnival Mardi Gras that month.
- November2026$131−14% vs avg3 sailings
- December2026$129−15% vs avg4 sailings
- January2027$95−38% vs avg5 sailingsCheapest
- February2027$113−26% vs avg4 sailings
- March2027$154+1% vs avg4 sailings
- April2027$150−1% vs avg4 sailings
- May2027$179+17% vs avg6 sailings
- June2027$220+44% vs avg6 sailingsMost expensive
- July2027$215+41% vs avg7 sailings
- August2027$148−3% vs avg6 sailings
- September2027$131−14% vs avg7 sailings
- October2027$130−15% vs avg6 sailings
- November2027$141−8% vs avg7 sailings
- December2027$173+14% vs avg6 sailings
- January2028$132−14% vs avg7 sailings
- February2028$135−12% vs avg6 sailings
- March2028$164+8% vs avg7 sailings
- April2028$162+6% vs avg6 sailings
Where and how long you sail changes the price
Average balcony price per night on Carnival Mardi Gras, split by itinerary and cruise length. Percentages compare each group with the ship average of $153.
By route
3 routes- Bahamas$16174 sailings+6% vs ship avg
- Eastern Caribbean$13020 sailings−15% vs ship avg
- Western Caribbean$1277 sailings−17% vs ship avg
By length
Per nightWhat each cabin upgrade costs
multiple of inside cabin
Going from inside to suite on Carnival Mardi Gras adds $132 a night per person, 2.2× the inside fare.
How Carnival Mardi Gras fares move before sailing
Fares on Carnival Mardi Gras have tended to rise in the last 60 days before sailing, by about 3% compared with 3-6 months out.
Based on 102 past sailings of Carnival Mardi Gras that departed between July 2024 and October 2026. Each point is the average balcony fare per night quoted at that point before departure, measured against the same sailings' fares 3-6 months out.
All 4 Carnival Mardi Gras itineraries
Today's average balcony price per night for each itinerary Carnival Mardi Gras sails, across all of its upcoming departures, against the ship's average of $153. The trend line shows the average fare by departure month.
- Avg per night$127From$79vs avg−17%Departures7 datesBelow average
- Avg per night$130From$85vs avg−15%Departures20 datesBelow average
- Avg per night$155From$122vs avg+2%Departures49 datesTypical
- Avg per night$172From$139vs avg+13%Departures25 datesAbove average
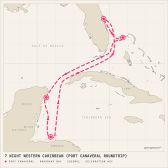
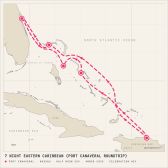
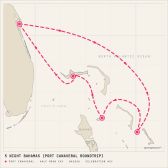

The lowest balcony fares on Carnival Mardi Gras
The 4 cheapest upcoming sailings at today's prices. Fares change daily, so check the deal before you book.
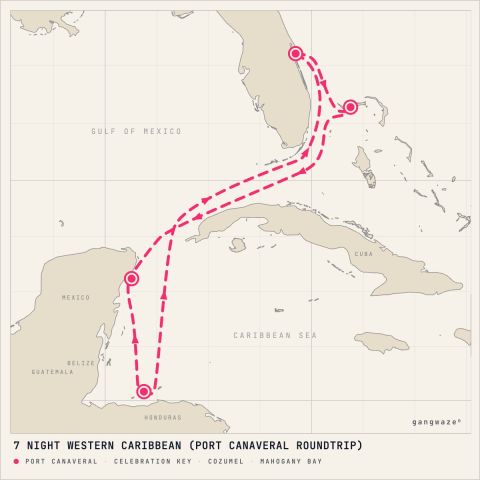 #1 cheapestSat, Dec 12, 20267 Night Western Caribbean · from Port Canaveral, Florida$79/ night−48% vs ship averageView deal
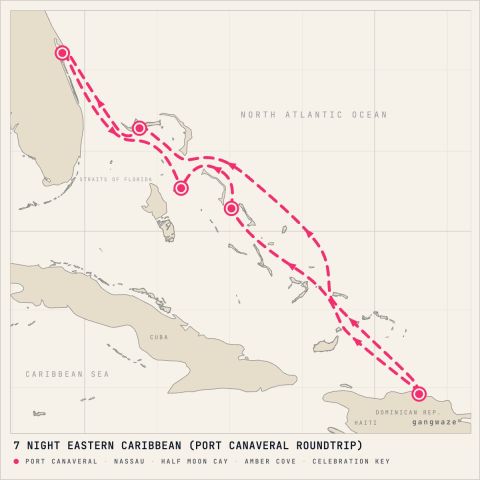 #2 cheapestSat, Jan 23, 20277 Night Eastern Caribbean · from Port Canaveral, Florida$85/ night−45% vs ship averageView deal
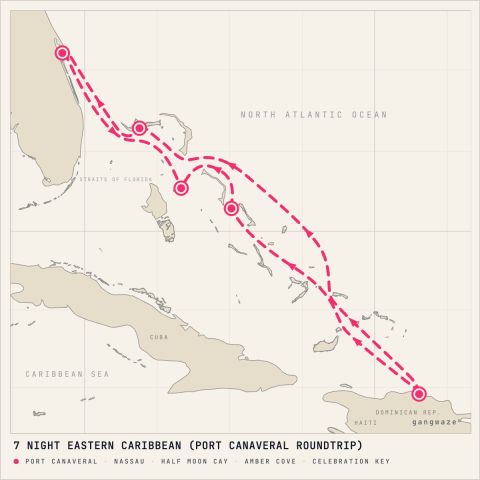 #3 cheapestSat, Jan 30, 20277 Night Eastern Caribbean · from Port Canaveral, Florida$88/ night−43% vs ship averageView deal
 #4 cheapestSat, Feb 27, 20277 Night Eastern Caribbean · from Port Canaveral, Florida$89/ night−42% vs ship averageView deal
Fares that changed in the last week
Sailings on Carnival Mardi Gras whose balcony fare moved most in the past seven days: the biggest drops and the biggest rises, today's fare against the one we had a week ago.



Why Carnival Mardi Gras prices where it does
Newer ships, recent refits and bigger ships tend to cost more. These are the facts behind the price of Carnival Mardi Gras.
Get an email when Carnival Mardi Gras drops in price
We'll email you Carnival Mardi Gras's biggest price drops each week. Unsubscribe anytime.
More price indexes
The same balcony figures for Carnival Mardi Gras's line, the whole market and the ships most like it.
- Cruise line indexCarnival Price IndexBalcony fleet average $167 a nightOpen index →
- Market indexCruise Price IndexBalcony average, all lines, $211 a nightOpen index →
- Sister ship · XL ClassCarnival Festivale Price IndexBalcony $199 a nightOpen index →
- Sister ship · XL ClassCarnival Celebration Price IndexBalcony $134 a nightOpen index →
Free to quote, chart and republish with a link back, under CC BY 4.0. Please cite it as:
Gangwaze Carnival Mardi Gras Price Index, November 7, 2026. https://gangwaze.com/cruise-price-index/carnival-cruise-lines/carnival-mardi-grasQuestions about Carnival Mardi Gras prices
How much does Carnival Mardi Gras cost per night?+
As of November 7, 2026, Carnival Mardi Gras averages $109 for inside, $141 for ocean view, $153 for balcony, $241 for suite per person per night, across its upcoming sailings with a live fare.
What is the cheapest month to sail Carnival Mardi Gras?+
Among sailings on sale now, January 2027 is the cheapest month on Carnival Mardi Gras, at $95 per person per night for a balcony cabin. June 2027 is the most expensive, at $220.
Is a balcony on Carnival Mardi Gras worth it?+
A balcony on Carnival Mardi Gras averages $153 per person per night, $12 (8%) more than an oceanview cabin at $141. Over a 7-night cruise that is about $83 more per person for your own outdoor space.
How does Carnival Mardi Gras compare with other Carnival ships?+
Carnival Mardi Gras costs 9% less than the average Carnival ship for a balcony cabin ($153 against $167 a night), the 23rd most expensive of the 30 Carnival ships in the index.
When should I book Carnival Mardi Gras?+
Fares on Carnival Mardi Gras have tended to rise in the last 60 days before sailing, by about 3% compared with 3-6 months out, across 102 sailings that departed between July 2024 and October 2026.
How many sailings is the Carnival Mardi Gras index based on?+
101 upcoming sailings with live balcony fares, as of November 7, 2026. Each sailing's latest fare from the last 30 days counts once, divided by its nights, and fares outside $30 to $25,000 a night are left out as errors.
How the index is calculated
The Carnival Mardi Gras index is the average of each upcoming sailing's latest fare per night, per person, in each cabin type, across every future Carnival Mardi Gras sailing with a live published fare. Fares include taxes and fees and are divided by the number of nights. Every sailing counts once, and fares outside $30 to $25,000 a night are left out as errors. The price history is the same calculation as of each month's end. The Carnival Cruise Line and market figures use the same method across the Carnival Cruise Line fleet and every major line Gangwaze tracks. Booking-window figures use sailings that have already departed. Prices are in US dollars and are not adjusted for inflation.